
How It Works
Clips align to your activity automatically.
Upload a .FIT file from your Garmin, Wahoo, or COROS and video clips filmed during that activity. MetricsOverlay places each clip at the correct point on the activity timeline and displays the data from that moment on the video.
The Editor
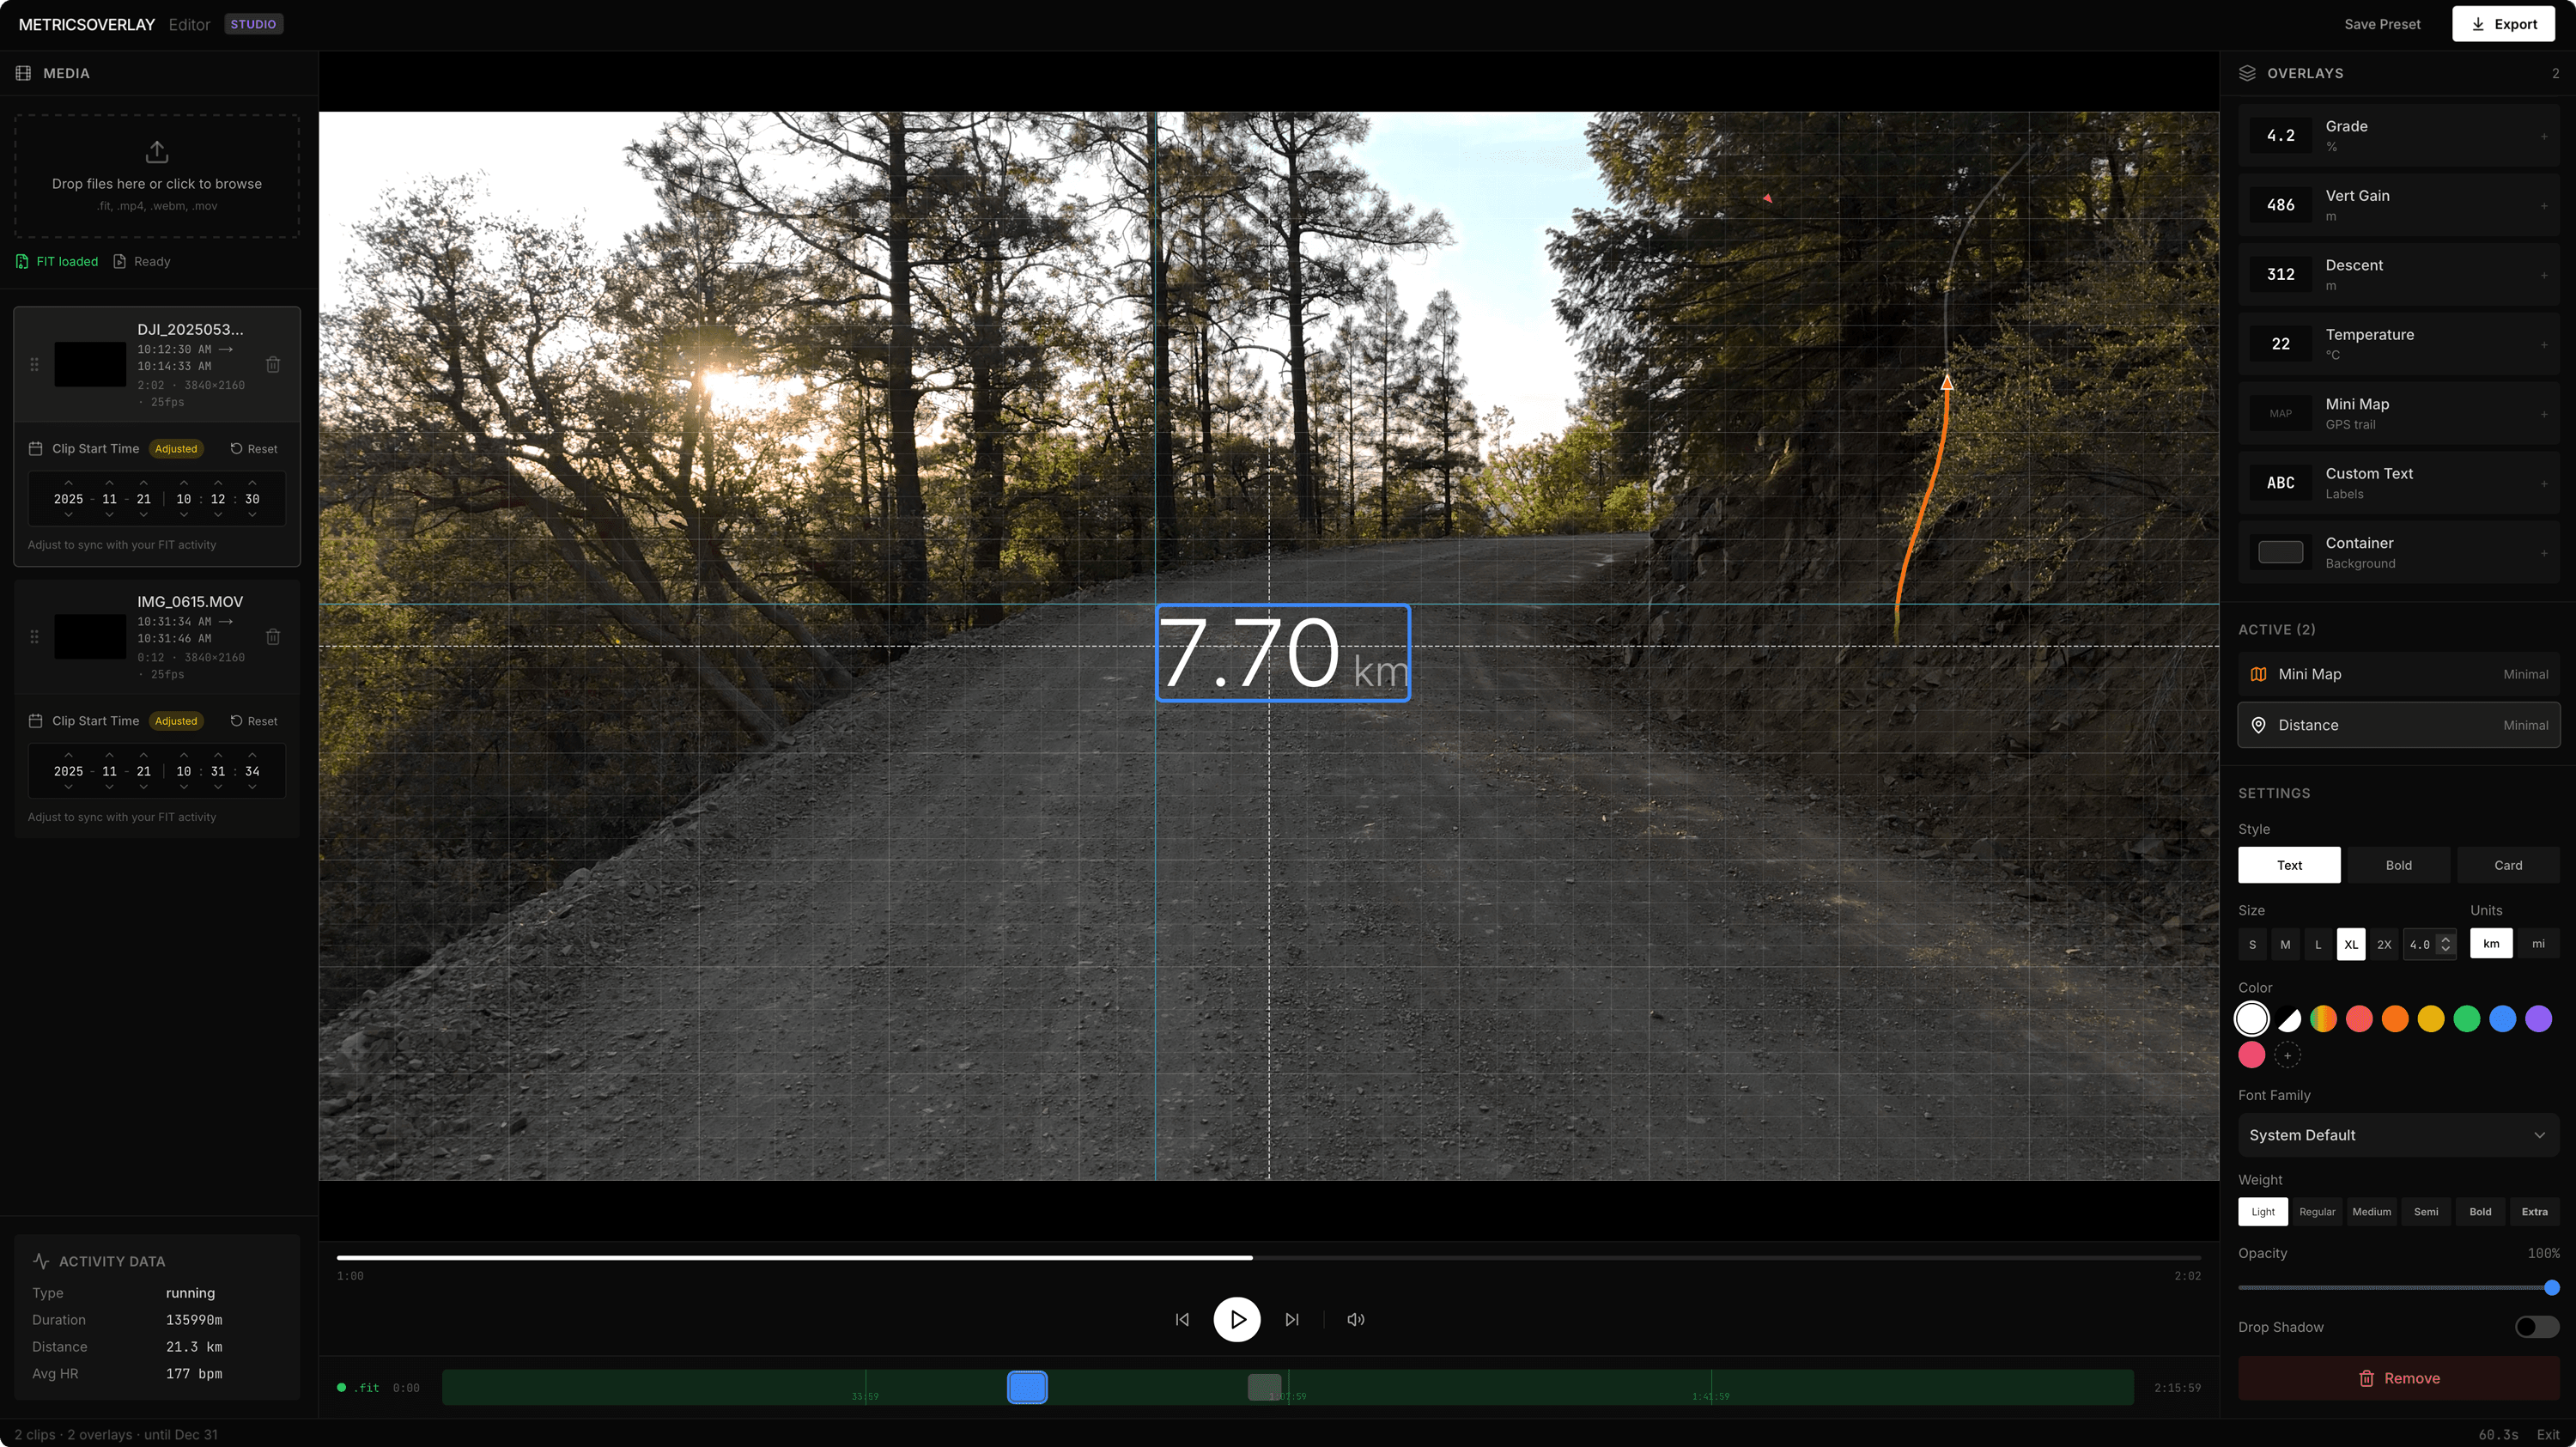
Position overlays visually.
Drag overlays directly on your video. Adjust size, style, color, and font from the sidebar. See your changes in real-time as the data animates.
Overlay Components
Everything your device records.
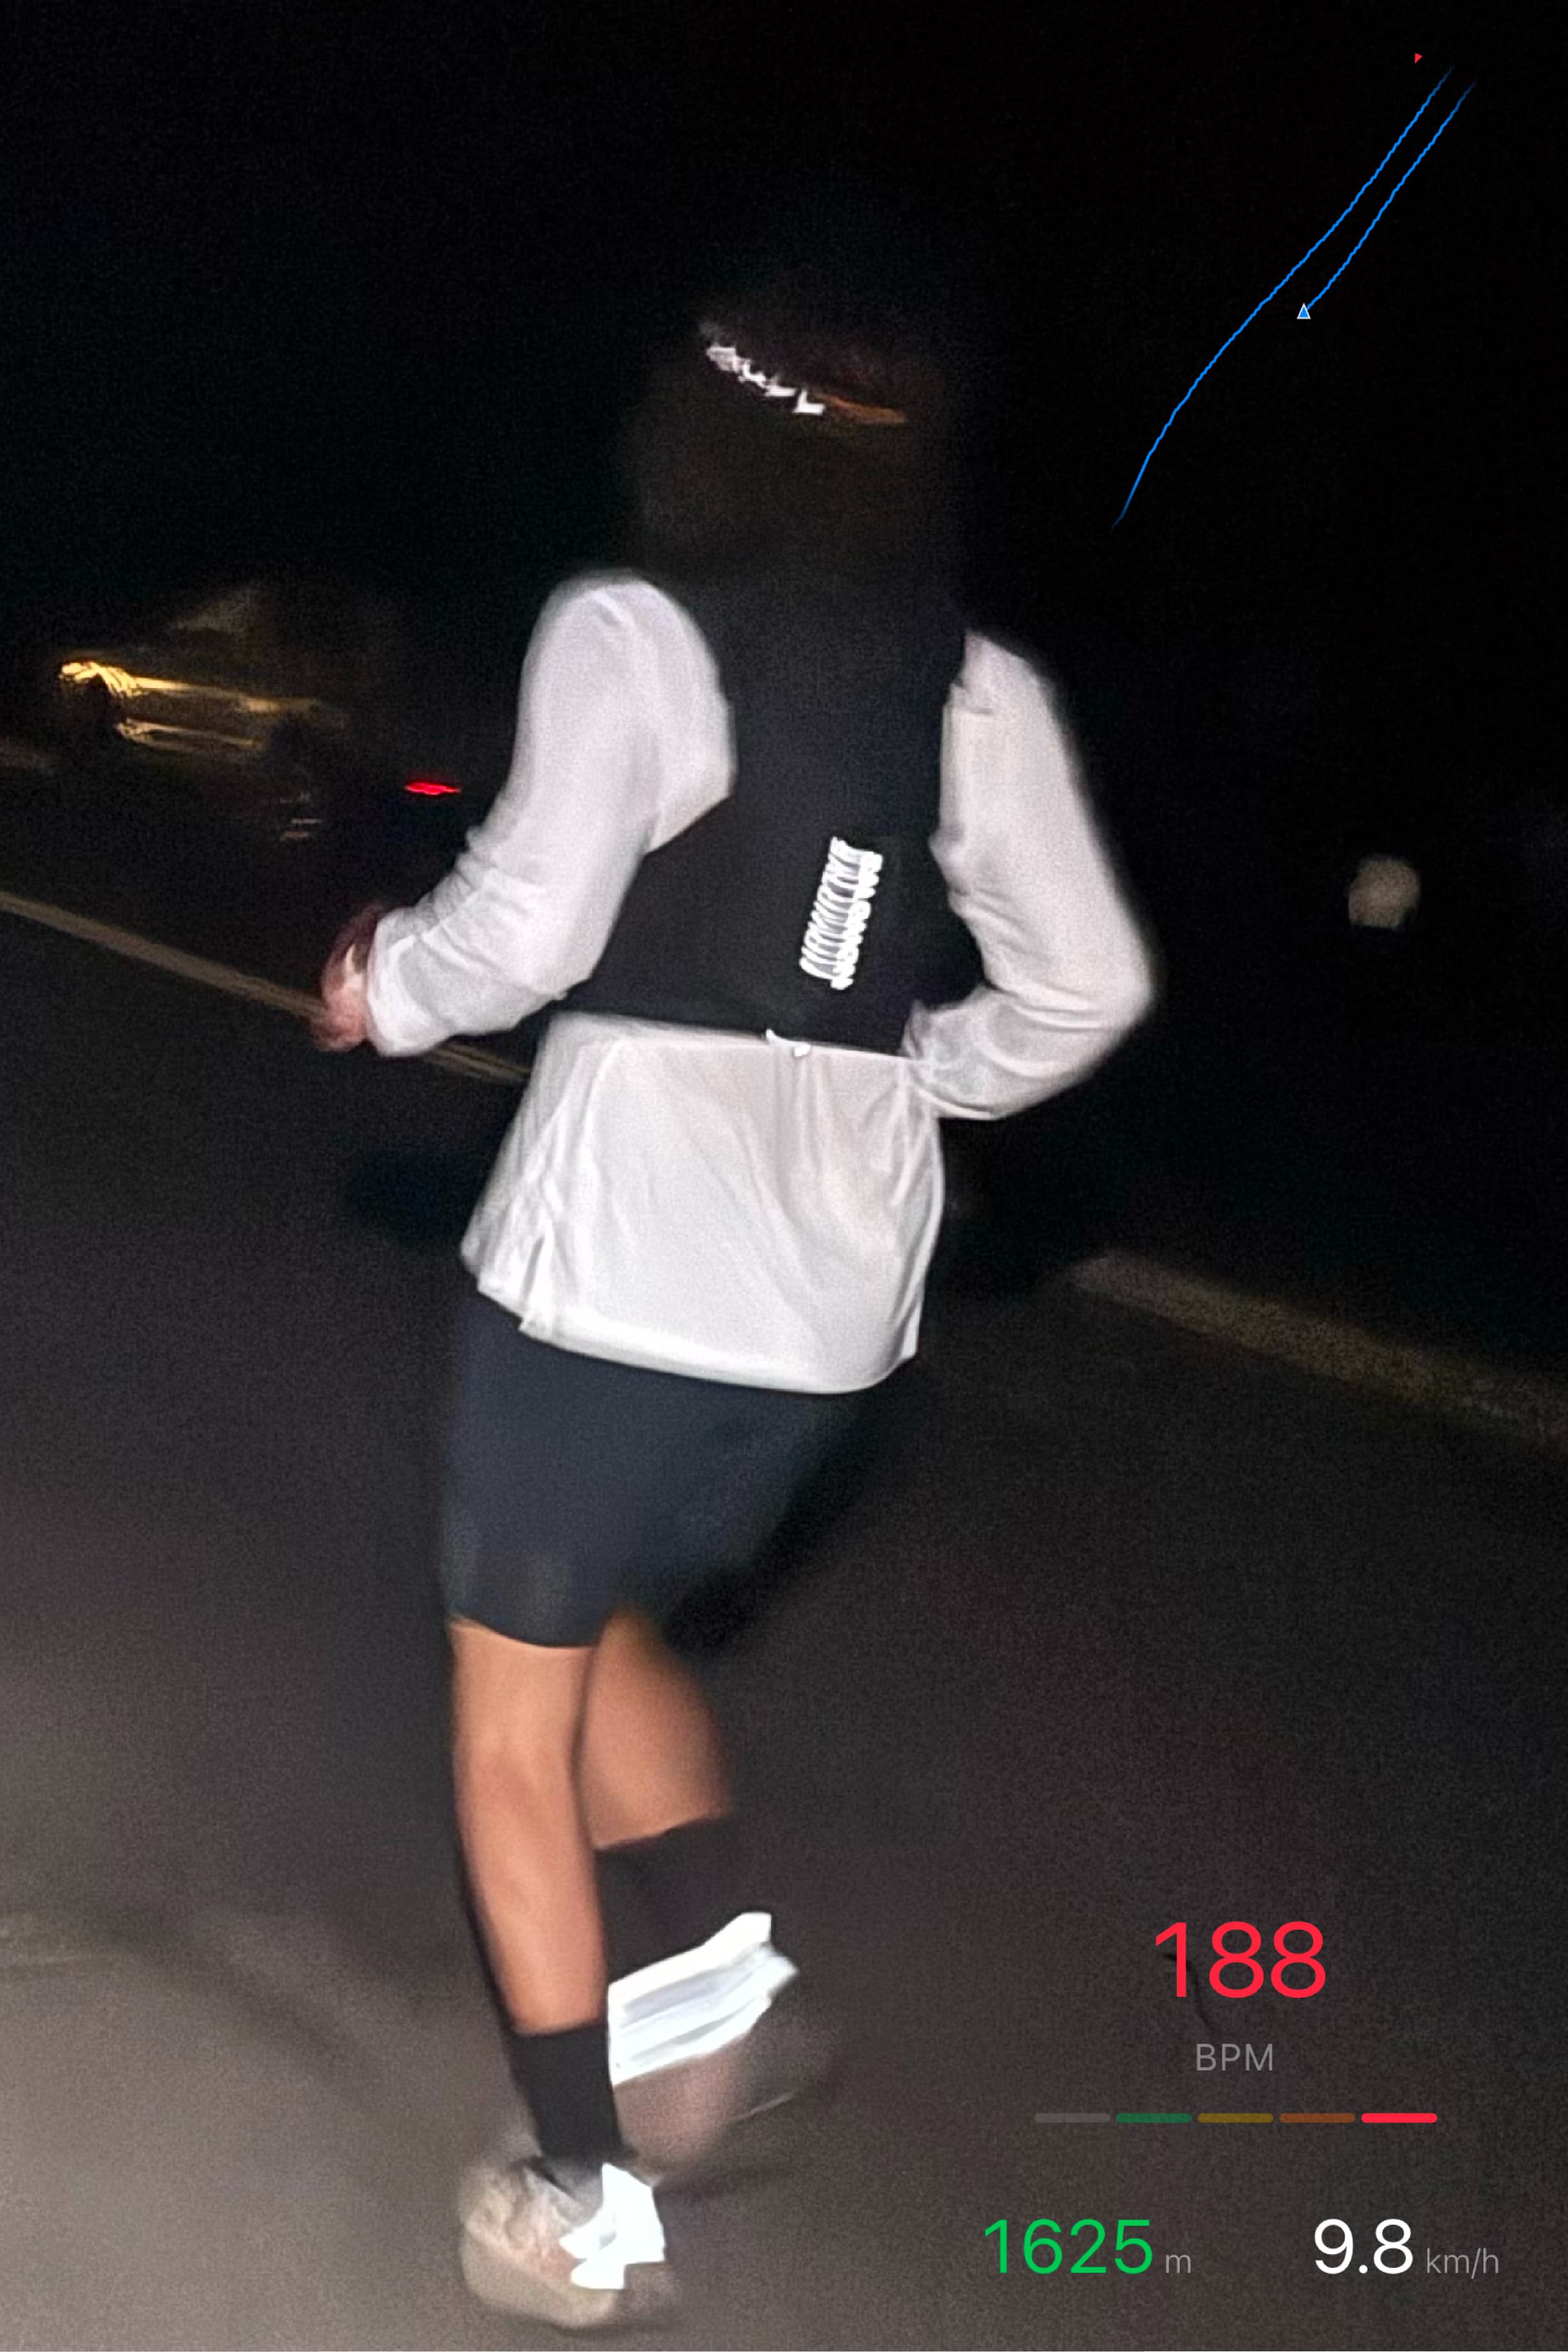
Heart Rate
Displays current BPM. Enable 'smart colors' to automatically change color based on heart rate zones. Gray when resting, green in zone 2, yellow in zone 3, orange in zone 4, red at max effort.
Speed & Pace
Shows velocity in your preferred unit. Displays as km/h, mph, or converts to pace format (min/km or min/mi) for runners. The value updates smoothly between FIT records.
Power
Displays cycling power in watts. Essential for structured training and pacing. Shows real-time wattage from your power meter, with smooth interpolation between FIT records.
Cadence
Shows pedaling cadence in RPM for cycling, or steps per minute for running. Helps viewers understand your rhythm and effort throughout the activity.
GPS Map
Shows your full route with a marker tracking your current position. The completed portion draws in as you progress. Choose overview mode for the full route, or follow mode to center on your position with the map rotating to match direction.
Elevation Profile
Displays altitude as a graph showing the full route profile. A marker moves along the graph to show current position. Great for seeing upcoming climbs or celebrating descents.
Pace
Shows pace in min/km or min/mi format, calculated from speed. Ideal for runners who prefer to track effort in time per distance rather than raw speed.
Distance
Displays total distance covered in km or miles. Accumulates throughout the activity, showing how far you've traveled from the start.
Elapsed Time
Shows how long you've been riding or running. Displays in HH:MM:SS format, counting up from the activity start.
Altitude
Shows current elevation in meters or feet. Perfect for mountain rides and hikes where altitude awareness matters.
Grade
Displays the current gradient as a percentage. Positive values indicate climbing, negative values indicate descending. Helps viewers understand the terrain.
Vertical Gain
Shows total meters or feet climbed throughout the activity. Accumulates only uphill segments, giving a clear picture of climbing effort.
Vertical Descent
Displays total elevation lost during the activity. The counterpart to vertical gain, tracking all downhill segments.
Temperature
Shows ambient temperature in Celsius or Fahrenheit when your device has a temperature sensor. Useful for documenting conditions during the ride.
GPS Visualization
Two ways to show your route
Overview Mode
Shows the full route at once. The trail draws as you progress through the activity. Use trim controls to highlight a specific section. Perfect for showcasing a single climb or segment.
Follow Mode
Centers on your current position with adjustable zoom. The map rotates to match your direction of travel. Shows where you've been and hints at what's ahead.
Smooth Data
Interpolation between records
Your device records data approximately once per second. But video runs at 30 or 60 frames per second. Without interpolation, the heart rate display would freeze for 30 frames, then jump to the next value.
MetricsOverlay calculates in-between values. If the FIT file says 142 BPM at second 5 and 148 BPM at second 6, frame 15 (halfway between) displays 145 BPM. The result is smooth, continuous data that moves naturally with your video.
This applies to all numeric values: heart rate, speed, power, cadence, altitude. GPS positions are also interpolated along the path between recorded coordinates.
Customization
Make it yours.
Every overlay can be styled to match your video. Choose styles, colors, and fonts.
+20 more in editor
Any hex color supported
Presets
Save, share, reuse.
Save Your Layouts
Found the perfect overlay arrangement? Save it as a preset. Name it, keep it, and load it instantly on your next project.
Download & Upload
Export presets as small JSON files. Back them up, move between devices, or import presets others have created.
Share With Others
Send your preset file to friends or teammates. They upload it and get your exact layout. Great for consistent team branding.
cycling-minimal.fitoverlay
3 overlays · 1.2 KB
Export
Multiple output formats
PNG Sequence
Pro WorkflowExports only overlays as transparent PNG frames. Import into DaVinci Resolve, Premiere, or Final Cut and layer over your original footage.
output: frame_00001.png, ...
H.264 Video
Hardware-accelerated encoding via WebCodecs. Burns overlays into video. Streams directly to disk for low memory usage. Great for sharing.
output: video_overlay.mp4
ProRes 422 HQ
BETALossless professional codec via FFmpeg. Burns overlays into video. Much slower (~7fps at 4K) but preserves maximum quality.
output: video_overlay.mov